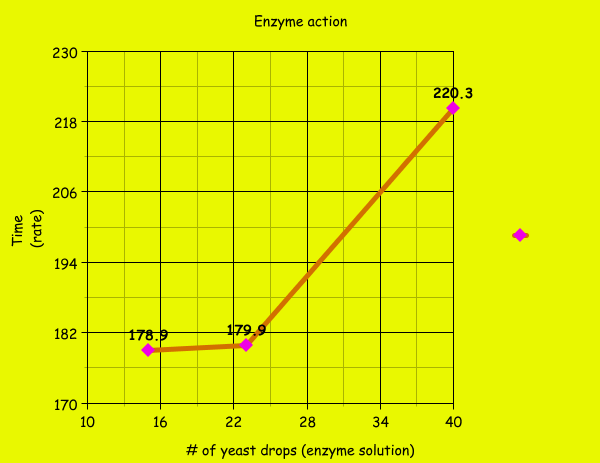
The first experiment we did was fill the beaker with with 3ml of water and alcohol. After used the computer and logged onto logger pro. After we used the yeast and put 15 drops of it in the first tube and we put the cap on it to see its reaction. After we graphed it and moved on to the second tube. We put the same amount of water and alcohol in this tube. But the yeast we increased to 23 drops, and we waited and graphed its reaction. For the last tube we did the same thing, but this time we increased the yeast drastically to 40 drops, and we watched as the graph spiked up. Here is our graph that i made, when we finished all three reactions.
For our second experiment we did kind of the same layout. But this time we switched up some of the materials to see what the reactions would do. This time we kept the yeast drops the same amount but changed the temperature of the water. So for the first tube we got 3 ml of alcohol and put it in the tube. Then we put 3 ml of room temperature water in the tube with the alcohol. After we used 32 drops of the yeast and watched the reaction. After this we moved on to the next one. We put alcohol and the 32 drops of yeast in the test tube with cold water this time. The reaction was very slower than what the others have been. So we graphed it and moved on. The last one we did had the alcohol and the 32 drops of yeast, but this time we added hot hot water to the test tube and watched it react. the reaction rate was very fast. The molecules in the water must have been moving faster. Here is out graph that we made after out experiments were done. It shows the spike in in rate from the different water temperatures.

Our last experiments we did dealt with most of the same things. But this time we changed the pH balances in all three test tubes. Our first test tube we mixed the 35 drops of yeast with a pH4 substance, that looked like a reddish colored water. After we watched the reaction we moved on to the second one. For our second mixture we had a pH7 substance that was a very light yellow color in the water. We watched it react and graphed it. Our last experiment we used we had a pH10 substance, that was a light blue color in the water. After we graphed it i noticed that the highest pH balance was the most that spiked on the graph. Here is our graph that we made showing the reaction speed of the pH substance with the yeast.

No comments:
Post a Comment